FSL
Preprocessing MRI images with FSL
All structural MRI data were preprocessed using a combination of neuroimaging tools including FSL (version 6.0.7.7), ANTs (version 2.2.0), and dcm2niix (version v1.0.20240202).
Prior to preprocessing, input files were converted to standardized NIFTI_GZ format using dcm2niix for DICOM files and fslchfiletype for ANALYZE format files. The preprocessing pipeline consisted of several sequential steps to ensure data quality and standardization across multiple datasets.
Overview of the preprocessing pipeline:
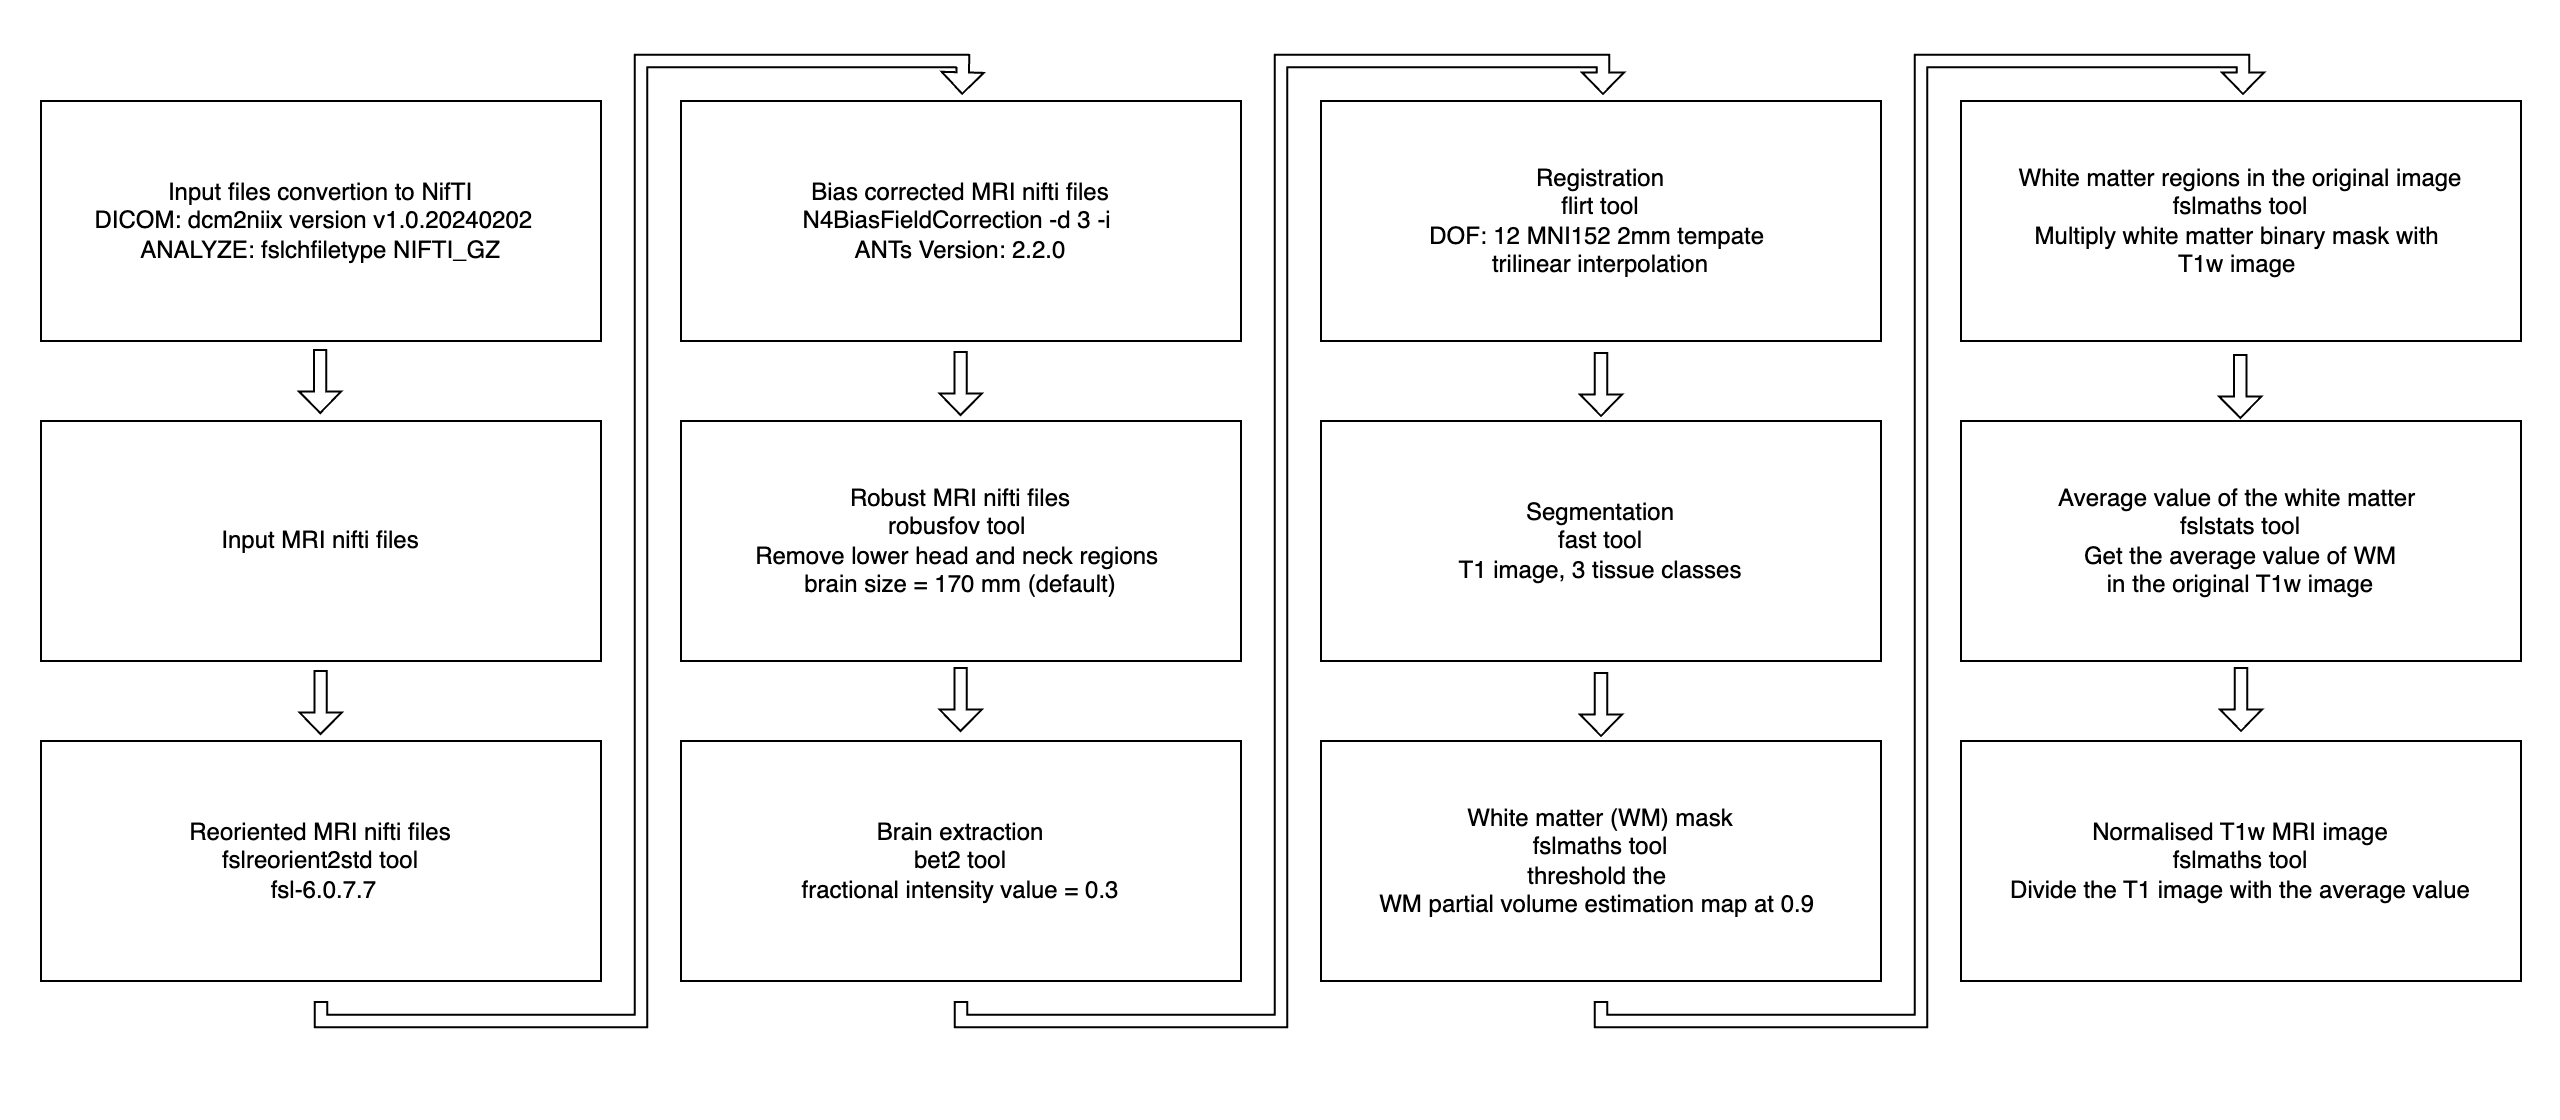
Step-by-step preprocessing:
- File Conversion & Reorientation
- DICOM to NIFTI using
dcm2niix - ANALYZE to NIFTI using
fslchfiletype - Reoriented to standard space using
fslreorient2std
- DICOM to NIFTI using
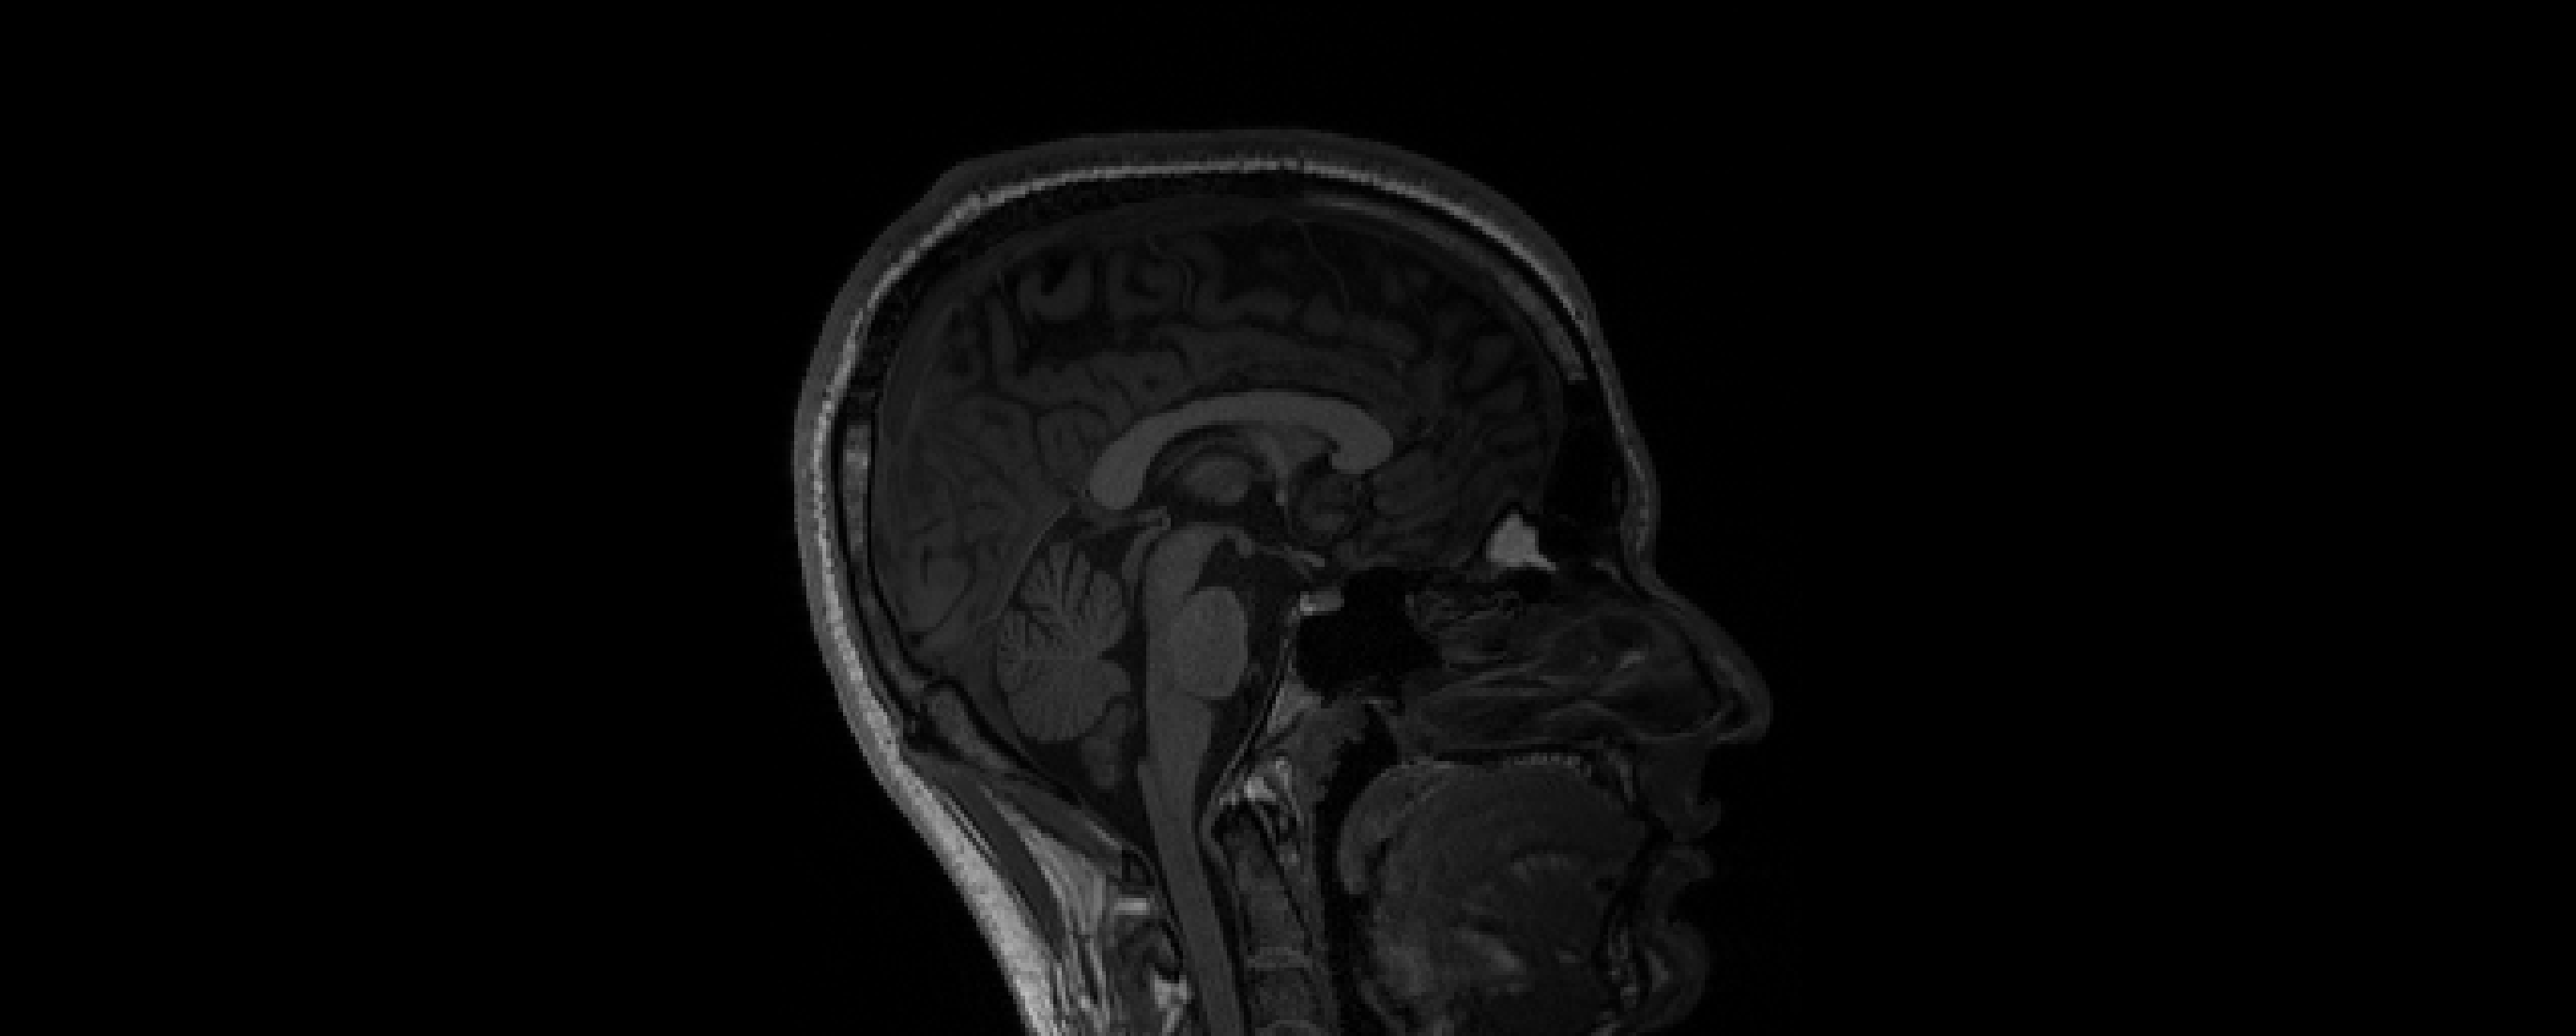
- Bias Field Correction
- Applied using
N4BiasFieldCorrectionfrom ANTs
- Applied using
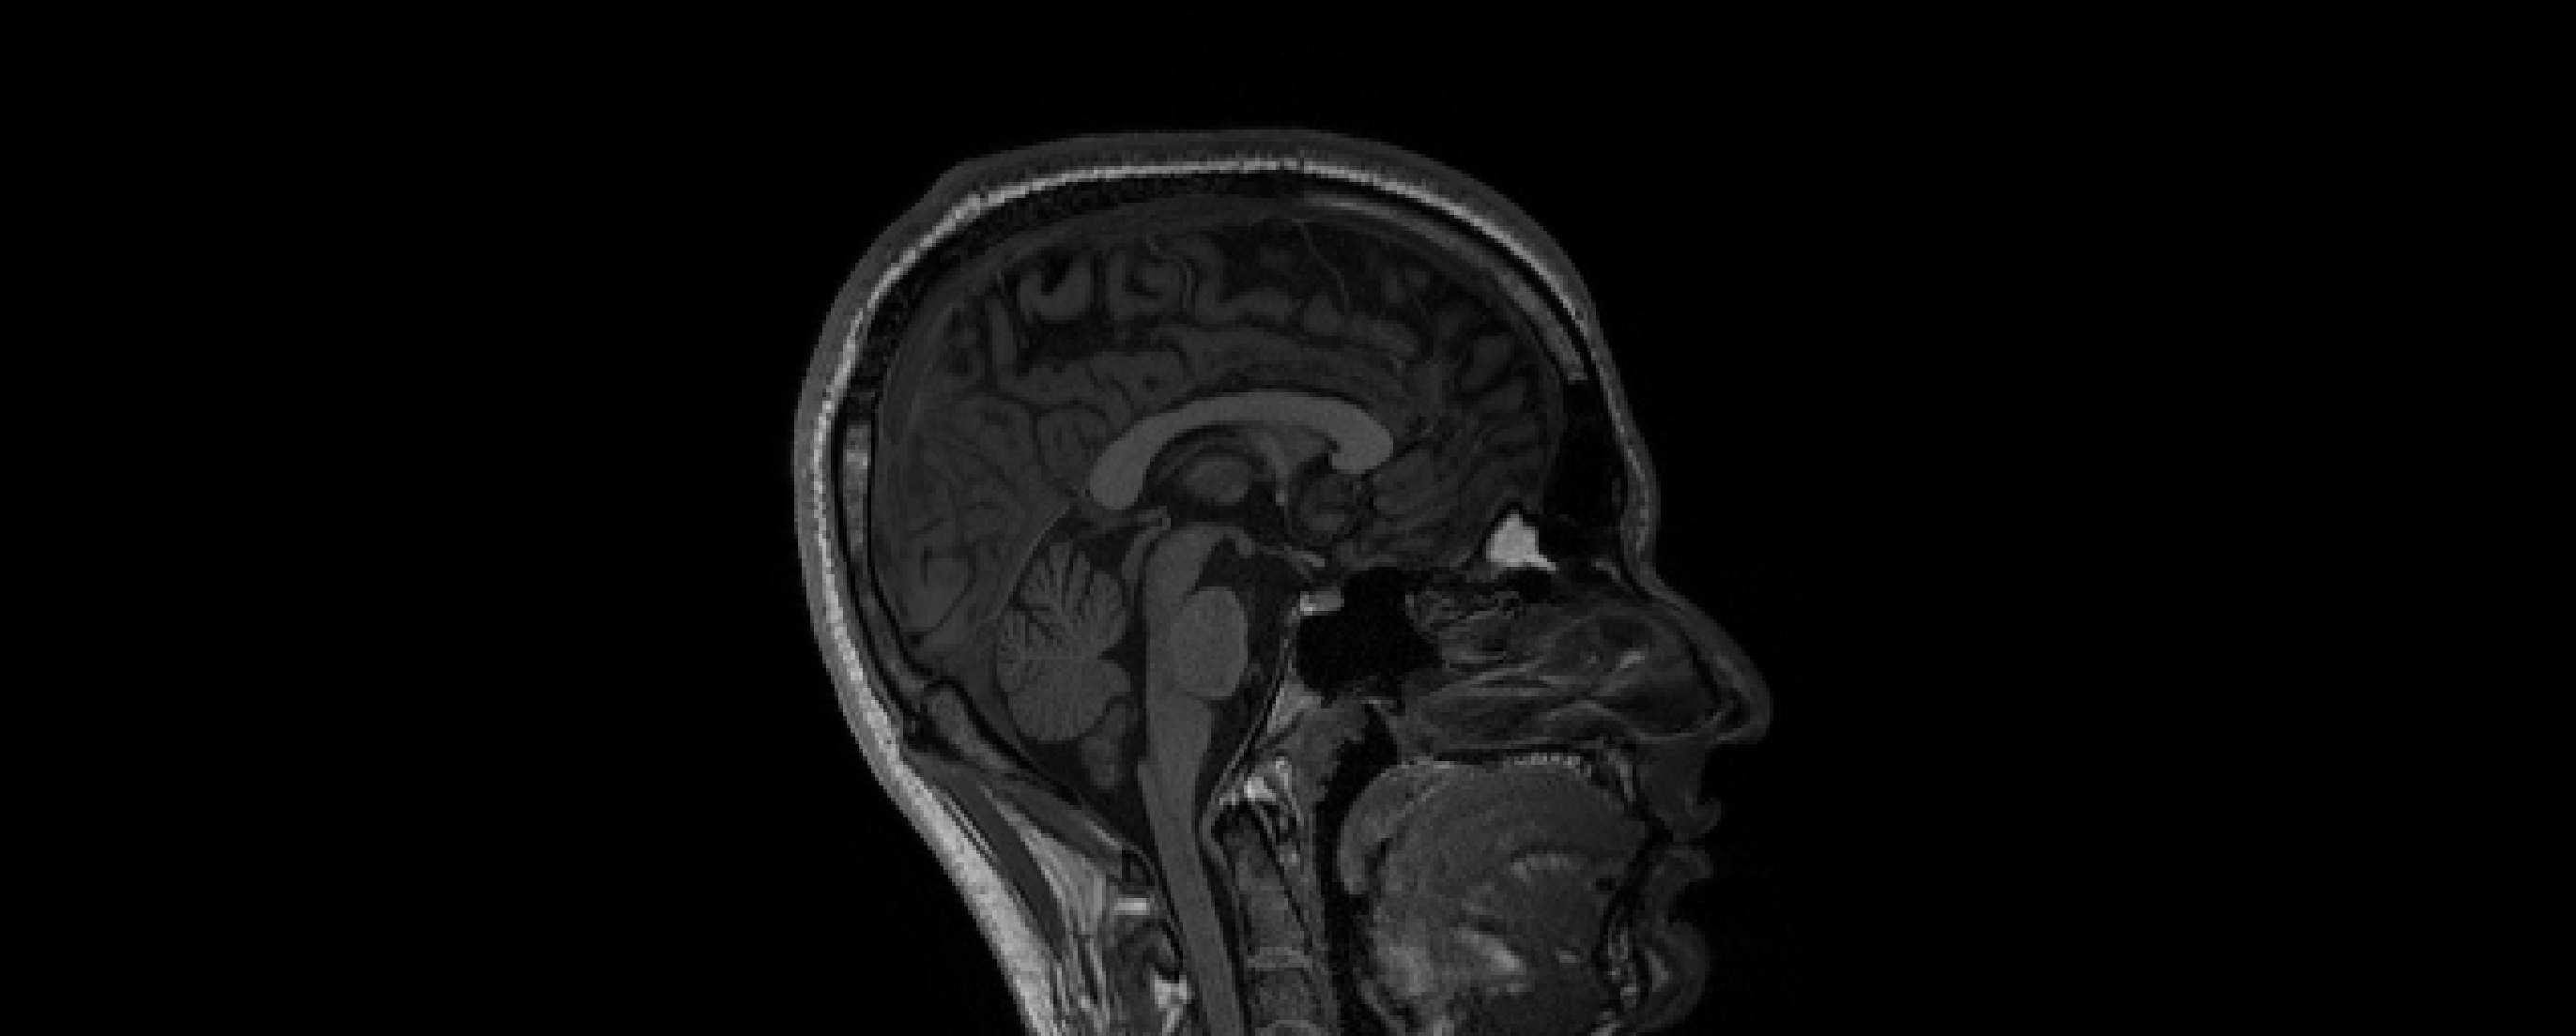
- Robust FOV Cropping & Brain Extraction
- Used
robustfovto crop neck/lower head - Skull stripping with
bet2, intensity threshold = 0.3
- Used
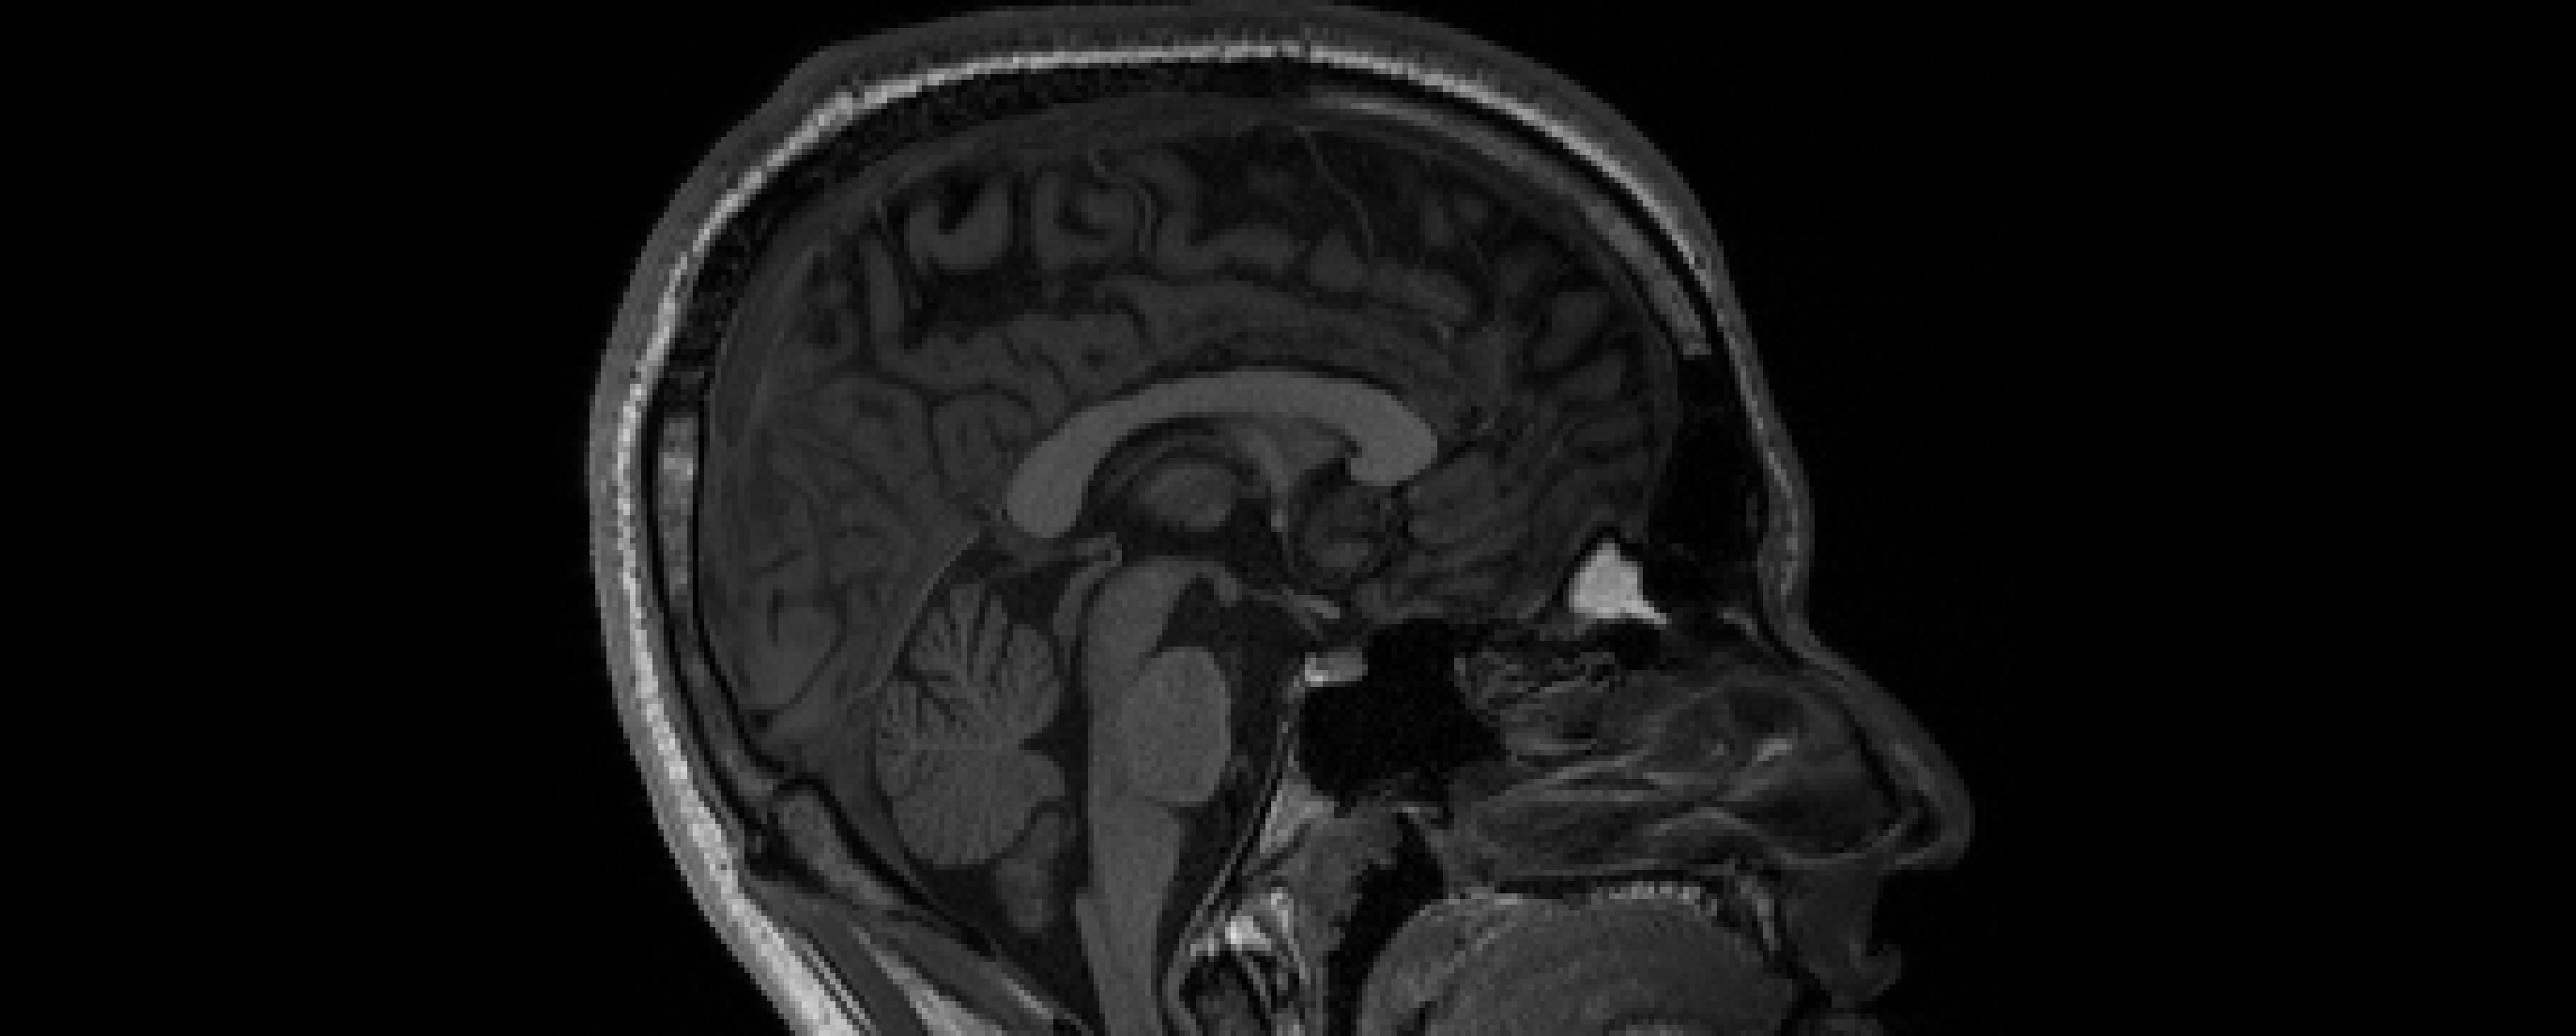

- Registration to MNI Space
- Linear registration using
FLIRT - DOF = 6 and 12
- Templates: MNI152 (1mm and 2mm)
- Linear registration using
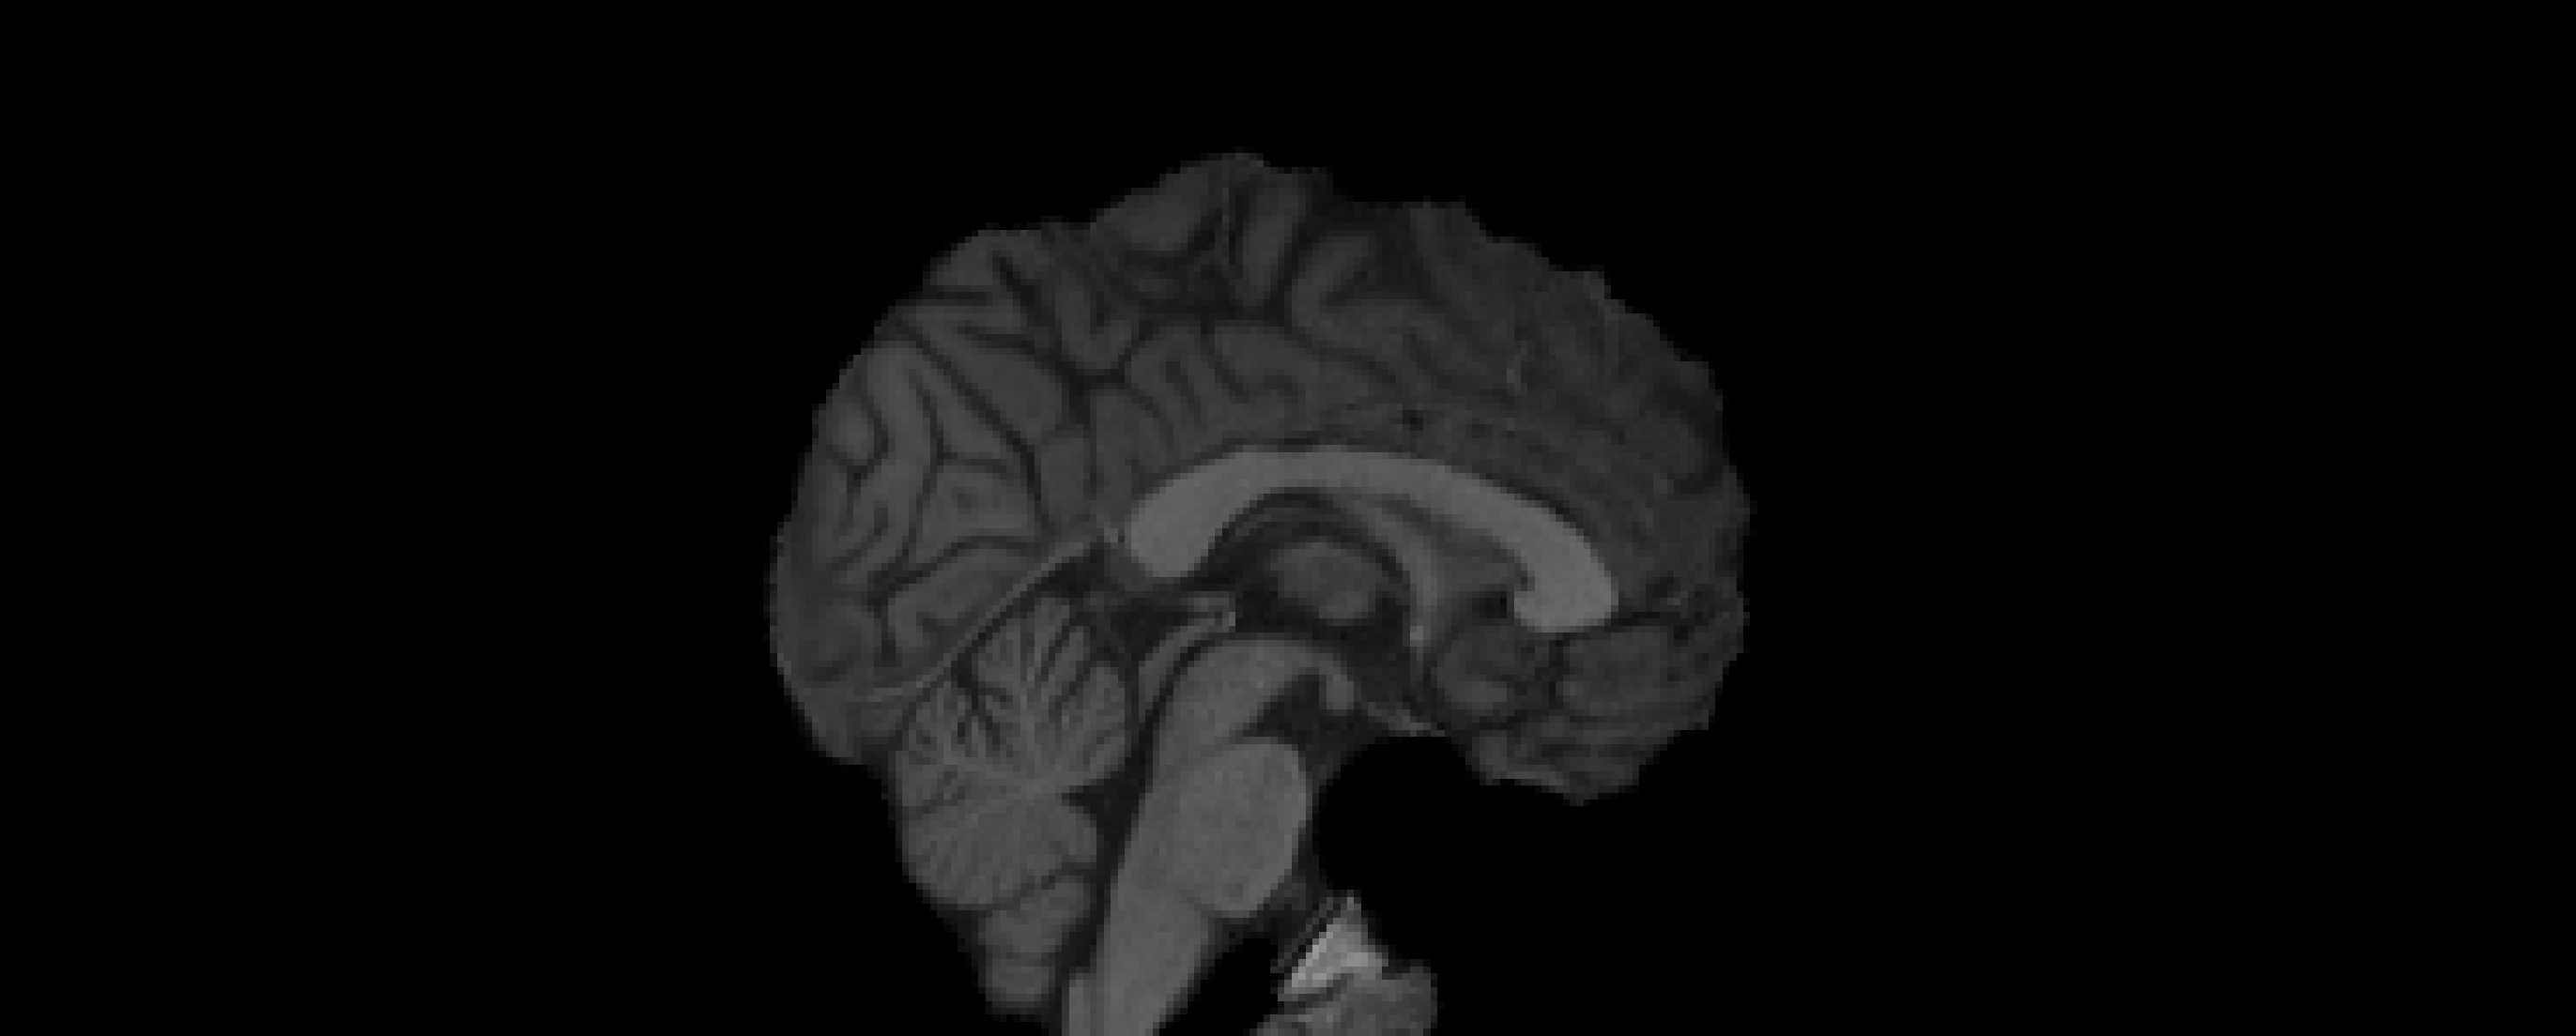
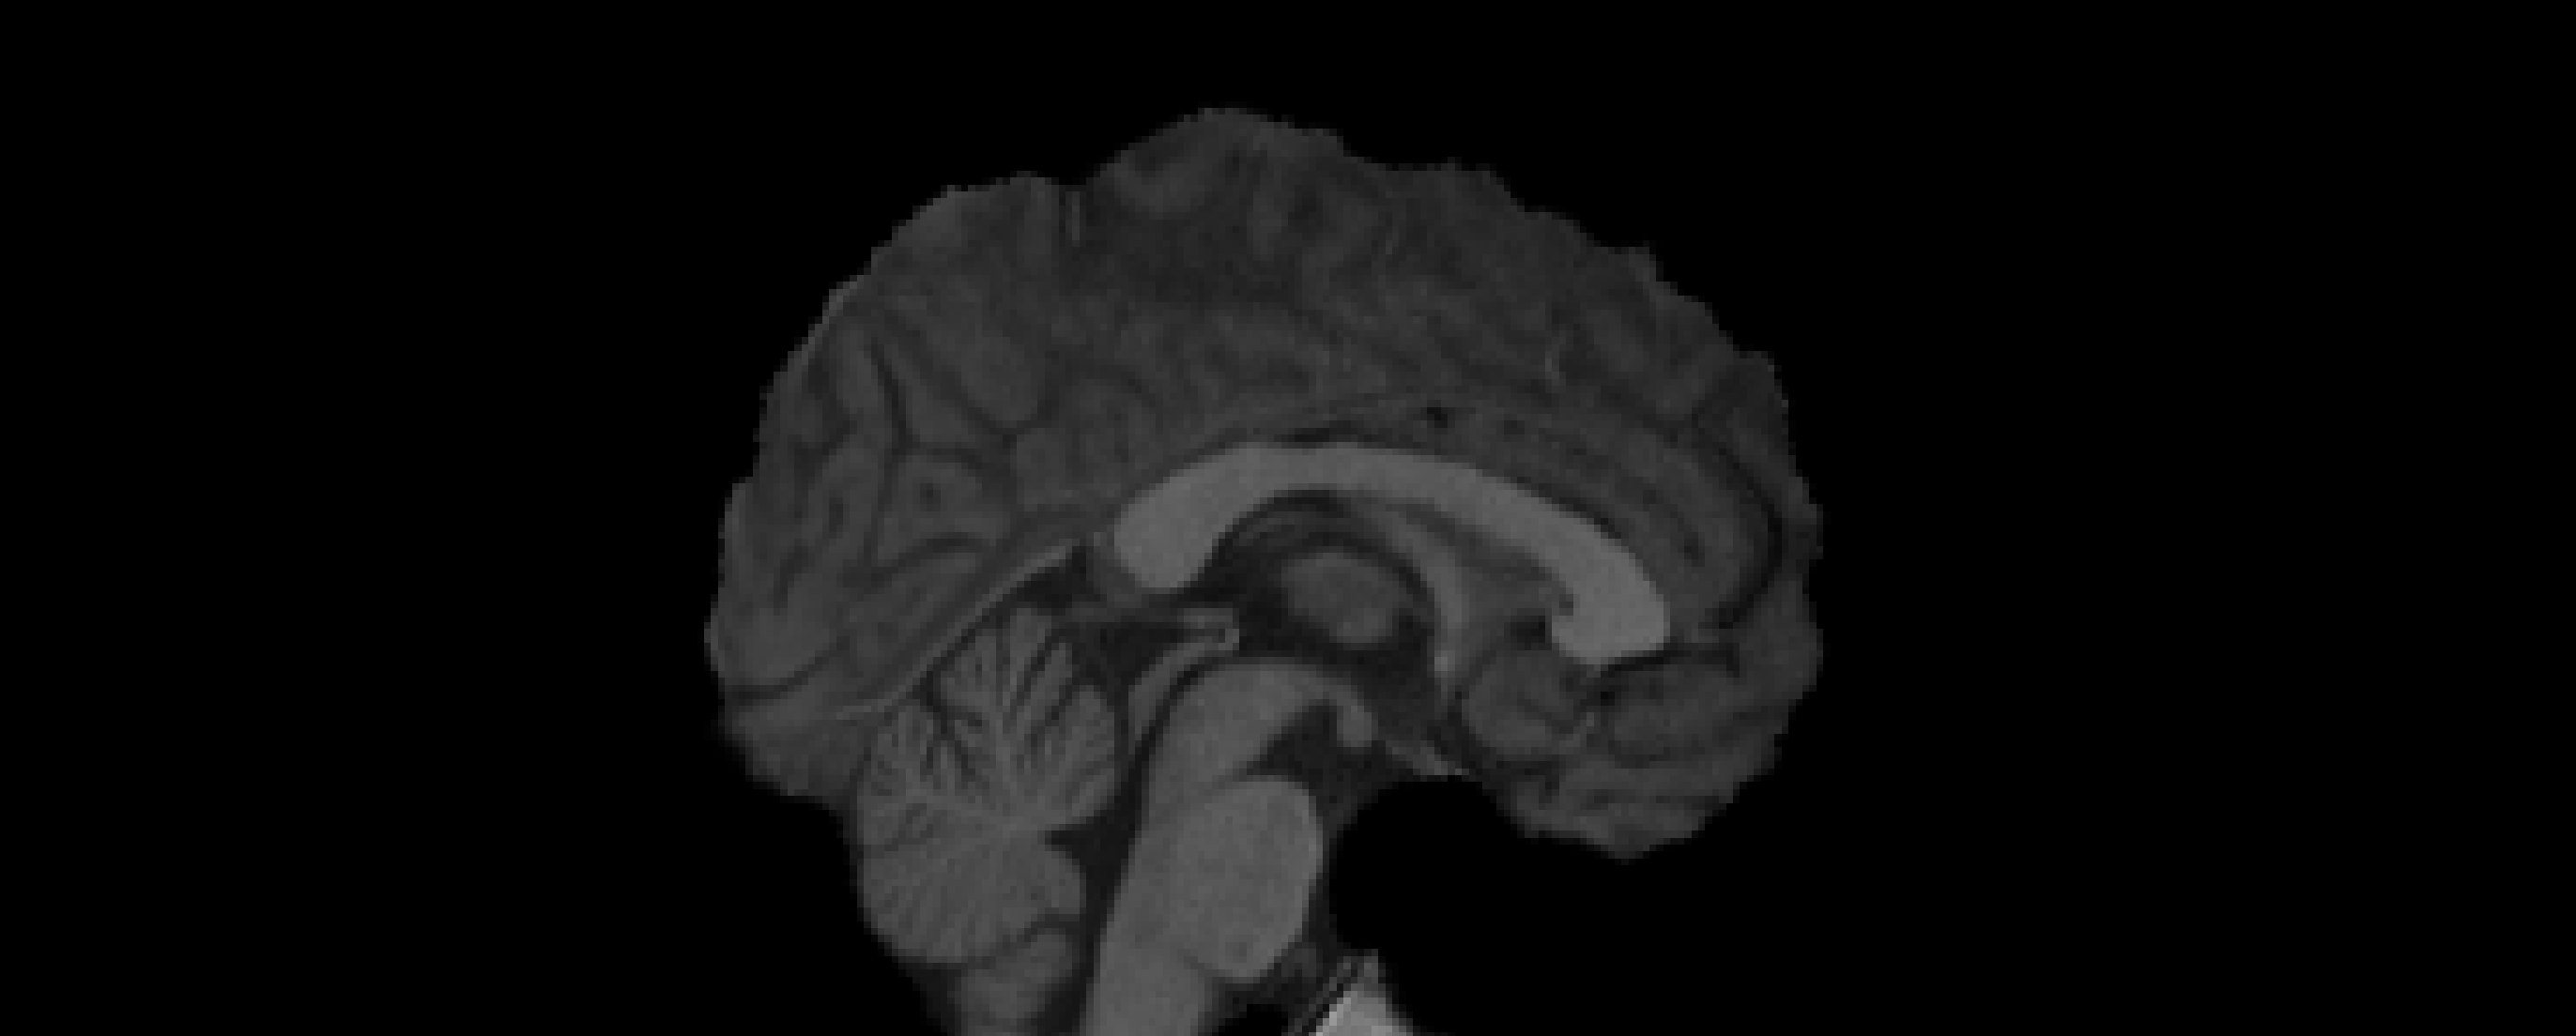
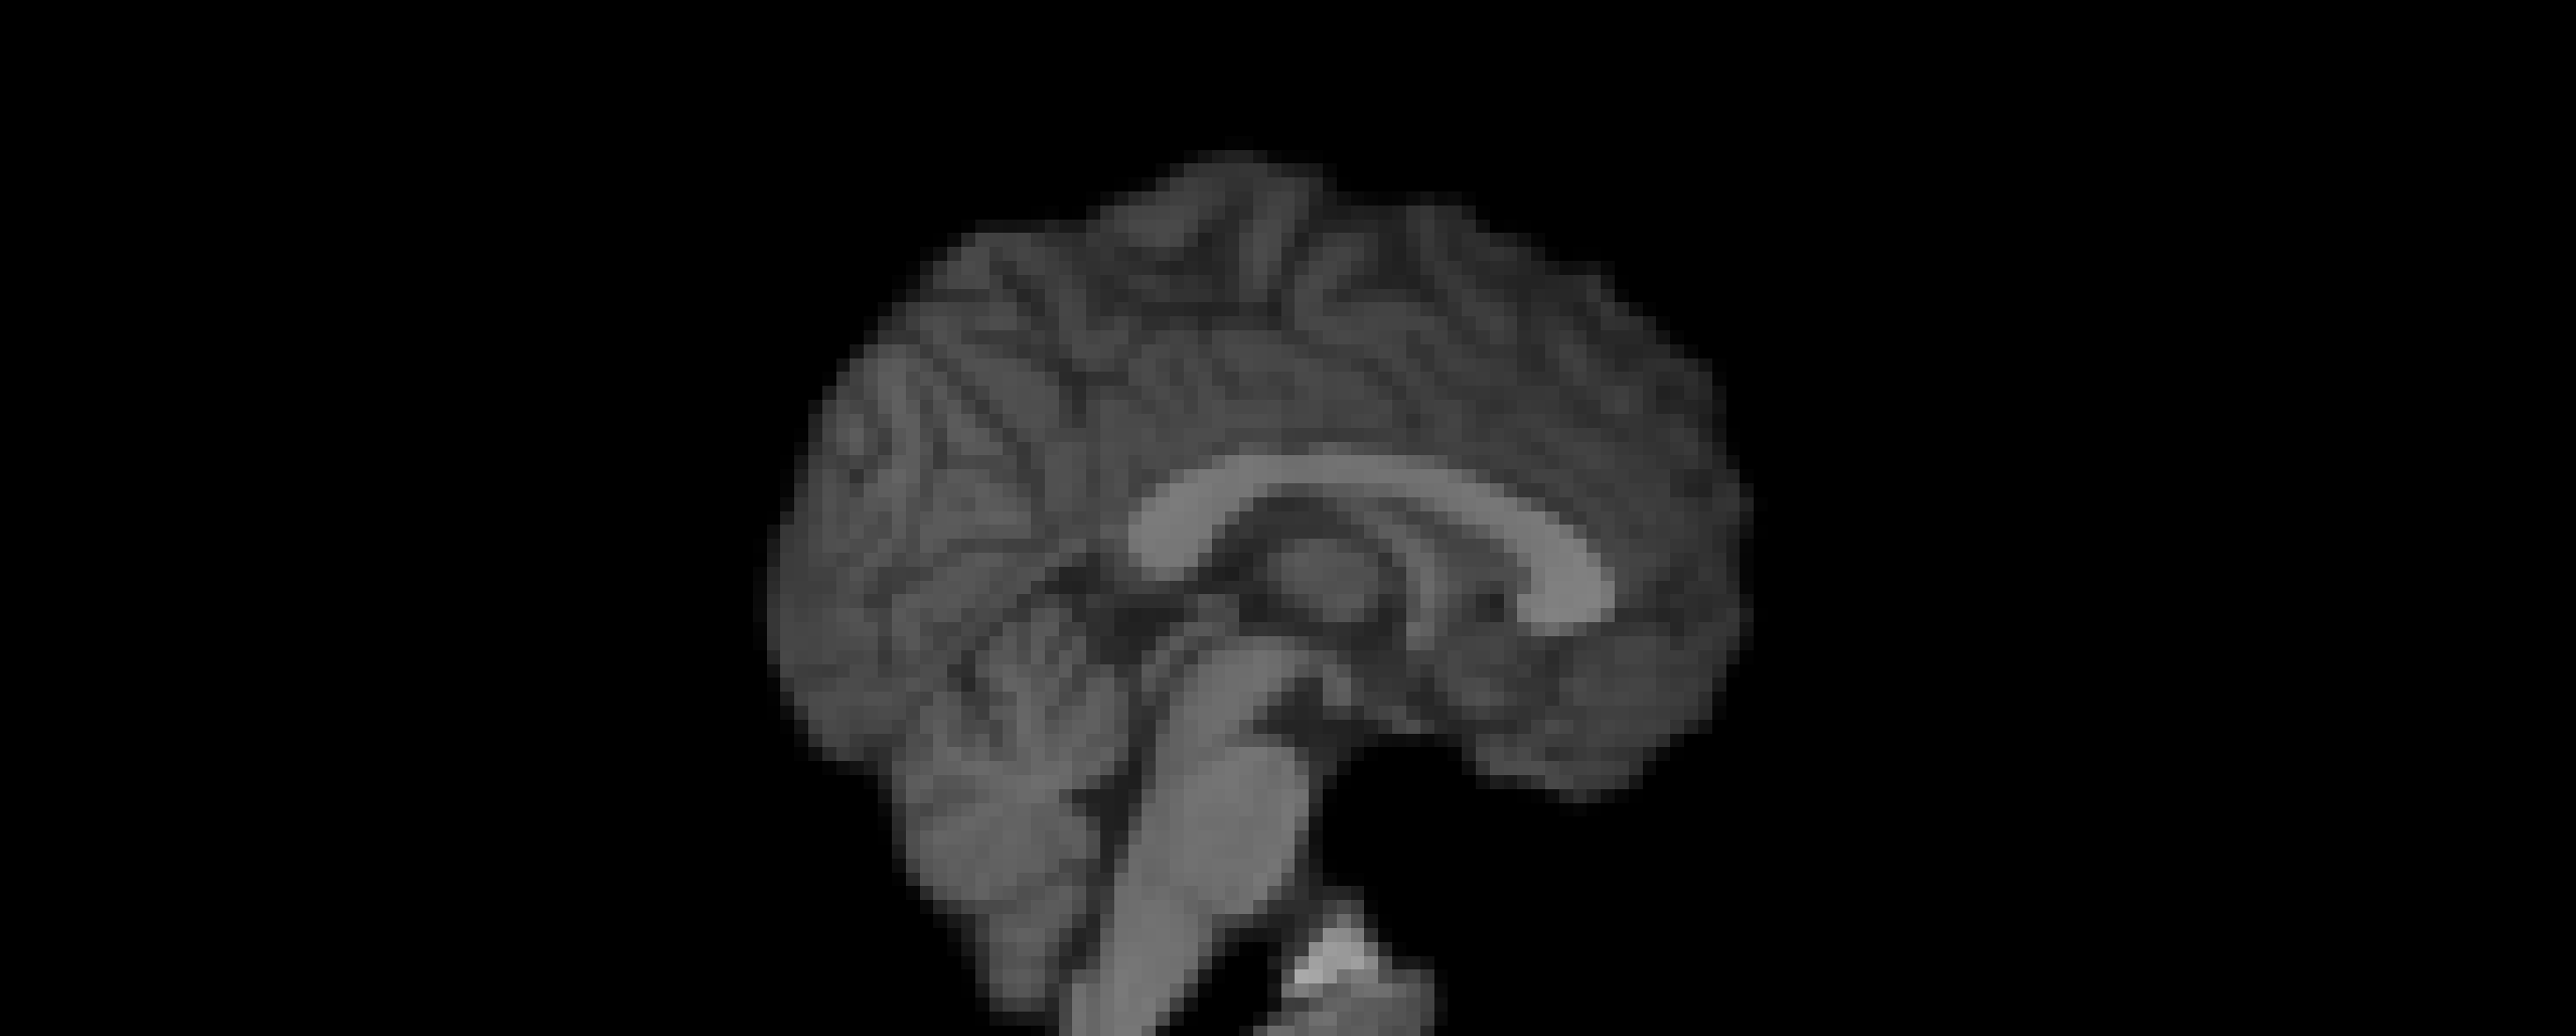
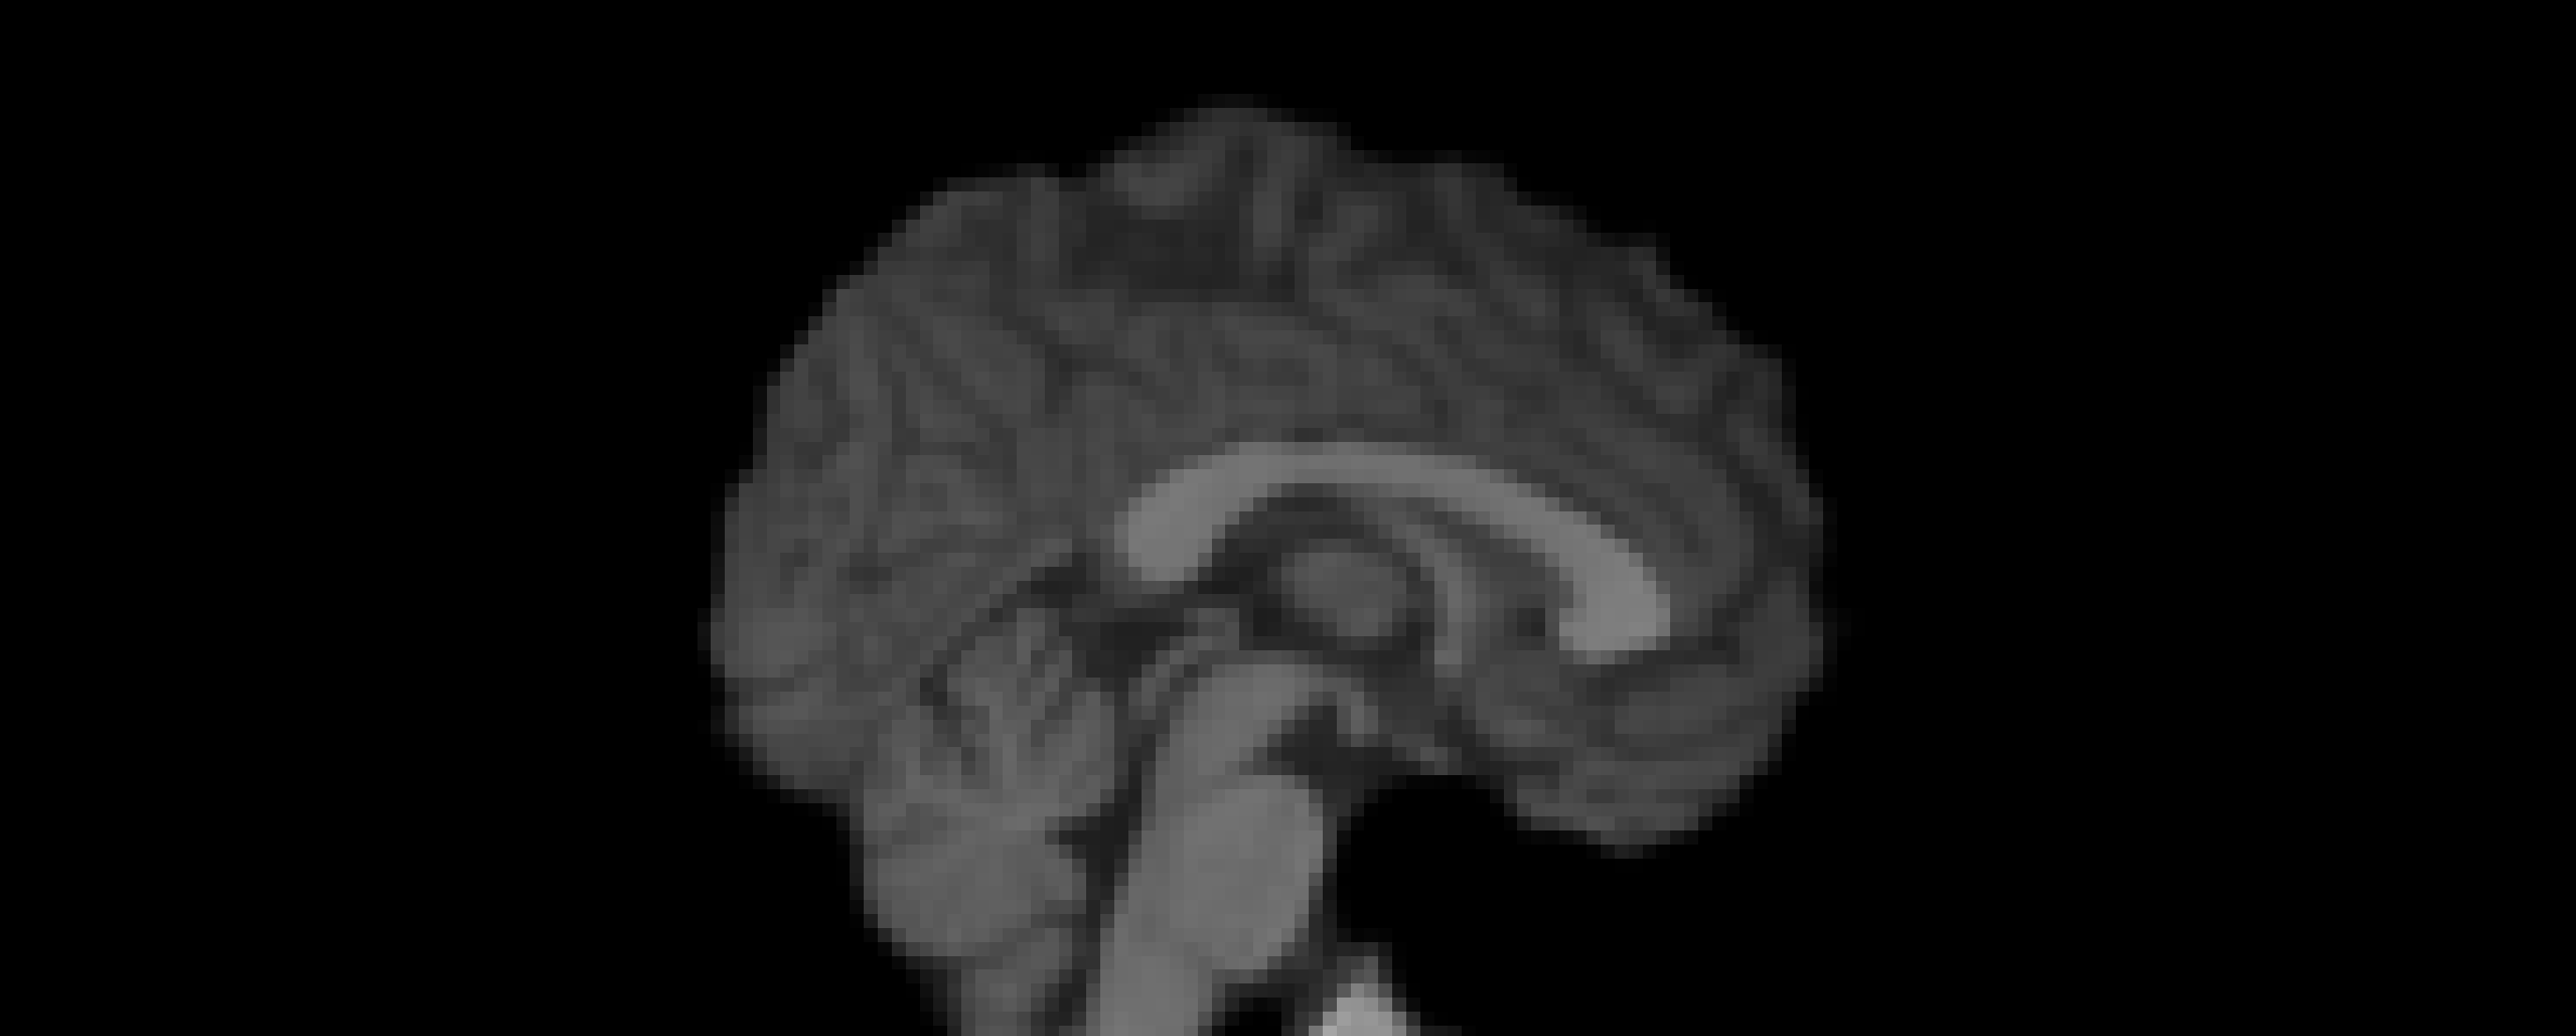
- Tissue Segmentation
- Performed using
FAST - Segmented into 3 tissue types: CSF, GM, WM
- Performed using
- White Matter Mask Creation
- Thresholded WM partial volume map at 0.9


- White Stripe Intensity Normalization
- Binary WM mask applied to T1w image
- Mean WM intensity computed using
fslstats - T1w image normalized using
fslmaths
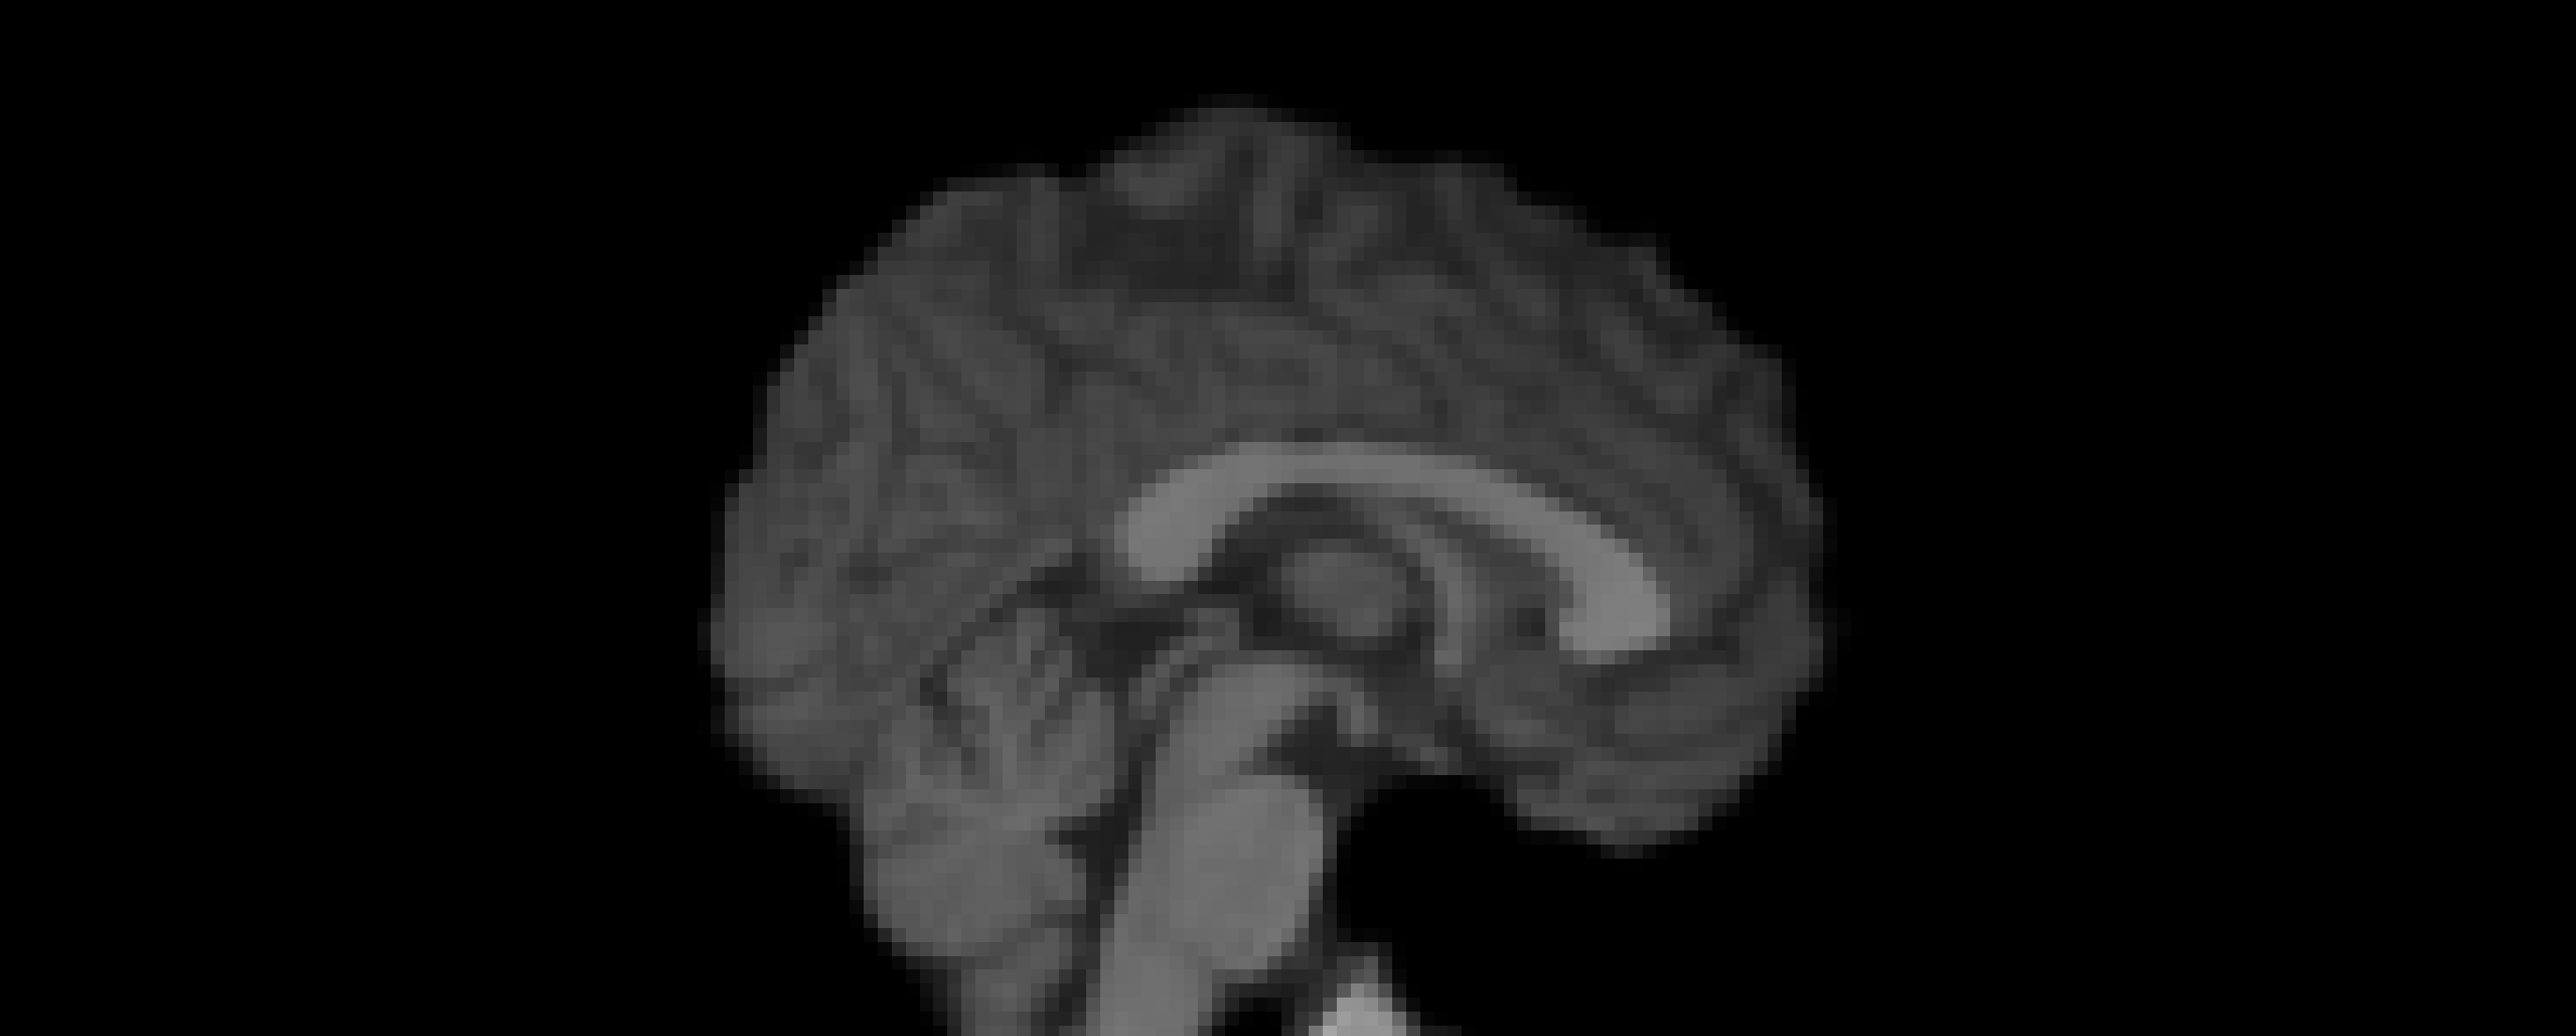
Additional Notes
Other normalization techniques including min-max normalization and histogram matching were explored. However, white stripe normalization was ultimately selected due to its biological interpretability—the histogram peaks corresponding to CSF, WM, and GM were consistent across datasets and visually preserved tissue contrast with minimal artifacts.
Hardware & Execution Environment
The pipeline was parallelized and executed on an HPC cluster with the following specs:
- CPU: Intel® Xeon® Gold 6240 (2.60GHz, dual CPUs)
- Memory: 192 GB RAM
This allowed robust and scalable preprocessing across large neuroimaging datasets.